Megamillions Pattern Analysis
As of 28 October 2017, the MegaMillions lottery changed to use 5 balls ranging from 1 to 70 followed by a sixth MegaBall ranging from 1 to 25. This historical analysis spans the current MegaMillions configuration with 862 drawings spanning from October 31, 2017 through the drawing on January 30, 2026. Check back on this page regularly for the latest, dynamically generated historical analysis following each new drawing.
| Least Frequent Numbers | |
|---|---|
|
On this page, you will find an analysis of the least frequently winning MegaMillions numbers. There is a school of thought that says "numbers will catch up" to the average. For example, if you flip a coin over a long enough timeline, the distribution of heads and tails will be even. Some players therefore believe the least common numbers "are due" to win. Return to the main page for more MegaMillions strategies and number statistics. |
|
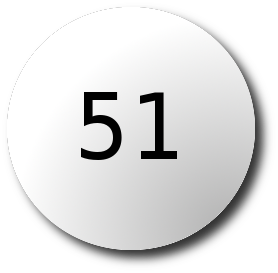 |
Appearing 4.99% of the time, the number 51 has won 43 times. |
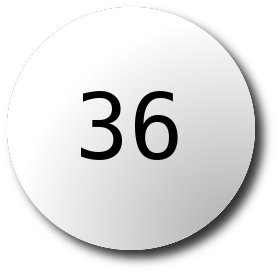 |
Appearing 5.68% of the time, the number 36 has won 49 times. |
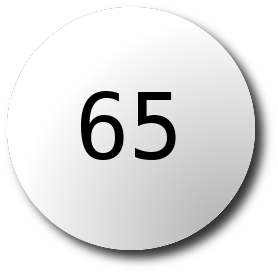 |
Appearing 5.68% of the time, the number 65 has won 49 times. |
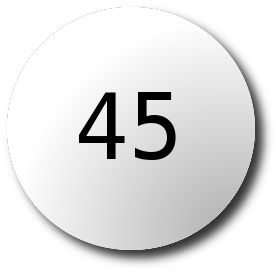 |
Appearing 5.8% of the time, the number 45 has won 50 times. |
 |
Appearing 5.8% of the time, the number 50 has won 50 times. |
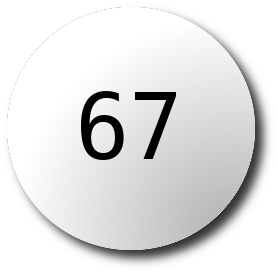 |
Appearing 5.8% of the time, the number 67 has won 50 times. |
 |
Appearing 5.92% of the time, the number 5 has won 51 times. |
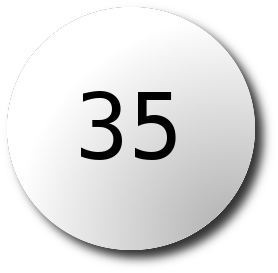 |
Appearing 5.92% of the time, the number 35 has won 51 times. |
NOTE: Remember, the historical occurence of numbers is NO GUARANTEE of continued performance or future occurence. While players have a 1 in 15 chance of winning a prize, the mathematical odds of winning the MegaMillions jackpot are still 1 in 250 million. For more chances at winning it big, try the PowerBall Pattern Analysis site as well for more dynamic lottery statistics.


